The budget report is probably the most important report to be presented to Councillors. Indeed, one of the requirements in the Internal Audit report is:
D. The precept or rates requirement resulted from an adequate budgetary process; progress against the budget was regularly monitored; and reserves were appropriate.
AGAR Annual Internal Audit Report
Easy PC Accounts supports profiled budgeting, a method preferred by other accounting packages like Quickbooks and Sage. This approach splits the annual budget into monthly segments, allowing for a more accurate comparison of receipts and payments. We believe this method provides clearer insights into the Council’s financial position with less need for extensive explanations.
As stated in the NALC Model Financial Regulations:
The RFO shall regularly provide the council with a statement of receipts and payments to date under each head of the budgets, comparing actual expenditure to the appropriate date against that planned as shown in the budget. These statements are to be prepared at least at the end of each financial quarter and shall show explanations of material variances. For this purpose “material” shall be in excess of £250 or 5% of the budget, whichever is the greater.
NALC Model Financial Regulations
We believe profiled budgets are essential for Councils to meet these requirements. This page details the budget reporting options available.
Detailed Budget Report Information
The budget report’s content relies on two factors:
- Budgets set up when account names (codes) are created.
- Options chosen from the menu.
Full details on setting up budgets can be found here. Below are descriptions and examples of the menu options. Please note there are two reporting options depending on specific needs. We are detailing the newer “Monthly/Quarterly Report” first and the “Budget Report” further down this page.
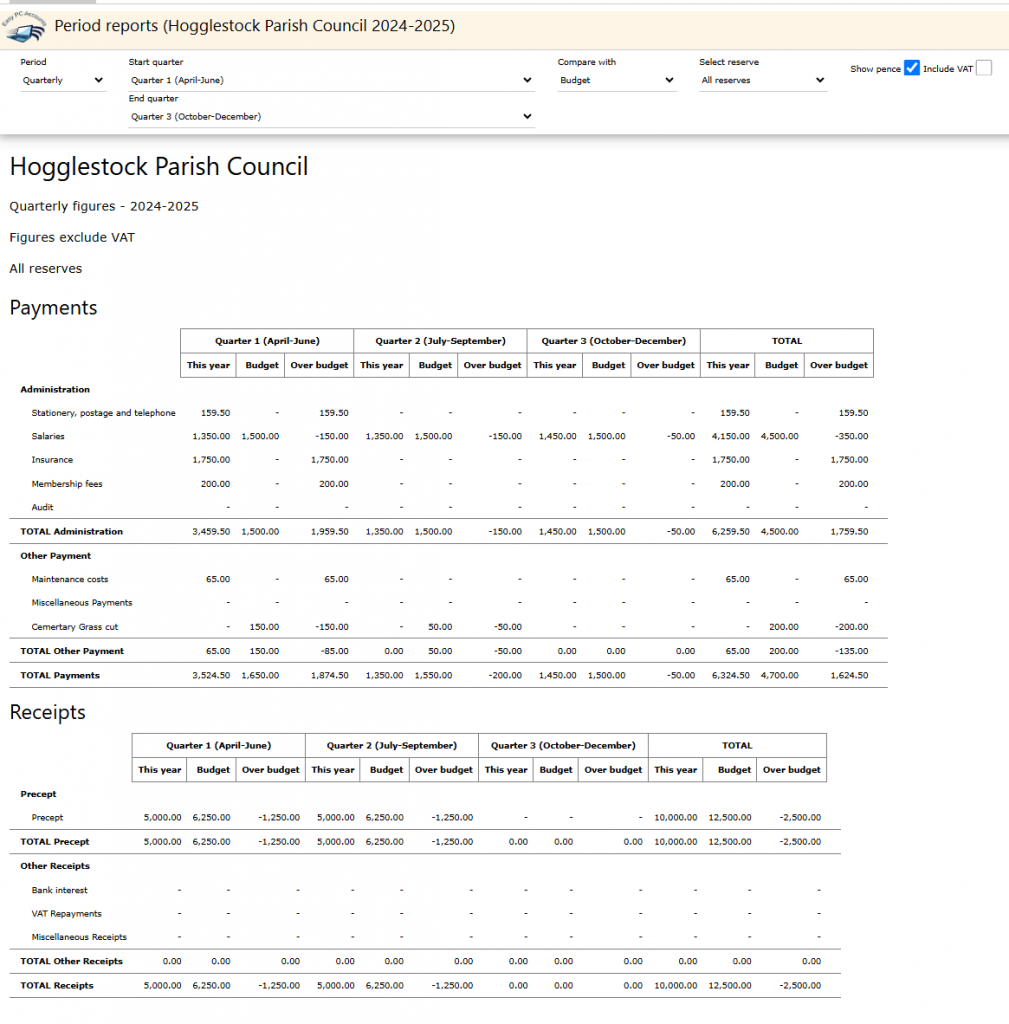
Monthly and Quarterly Reports
These reports provide a straightforward way to report on the budget, ensuring clarity and transparency in financial management.
Menu Options
- Period: Monthly or Quarterly period options
- Start month and end month: Sets the report’s date range. For example, setting the start month to April and the end month to June or
- Start quarter and end Quarter: displays figures for the relevant quarter.
- Compare With: select option to include last year or budget columns showing data for the selected period. Will display the variance (difference between values). Negative values indicate an overspend against the relevant item.
- Select Reserve: Filters the output for a specific reserve.
- Show pence: shows the pence values.
- Include VAT: Choose whether to include or exclude VAT in the displayed figures.
NOTE – Budgets are exclusive of VAT and it will show any receipts made against claims (relevant to the time period)

The Display option will update the data depending on the options chosen.
Export to Spreadsheet will allow you to improve the formatting and highlight any specifics.
Previous Budget Report Options
The following Budget Report has largely been replaced by the new report. However, some users may find that the options it provides offer greater flexibility, or they may prefer to use a combination of the two reports.
Budget Report
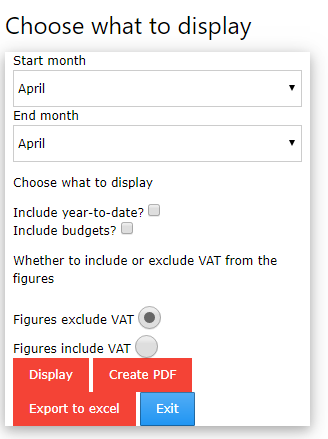
Menu Options
- Start month and end month: Sets the report’s date range. For example, setting the start month to April and the end month to June displays figures for the first quarter.
- Include year to date: Tick this box to include columns showing data from the start of the year to the selected period.
- Include budgets: Adds columns showing the budget for the period and the variance (difference between actual spend or receipts and the budget). Ticking the year-to-date box adds these columns for the entire year as well.
- VAT: Choose whether to include or exclude VAT in the displayed figures.
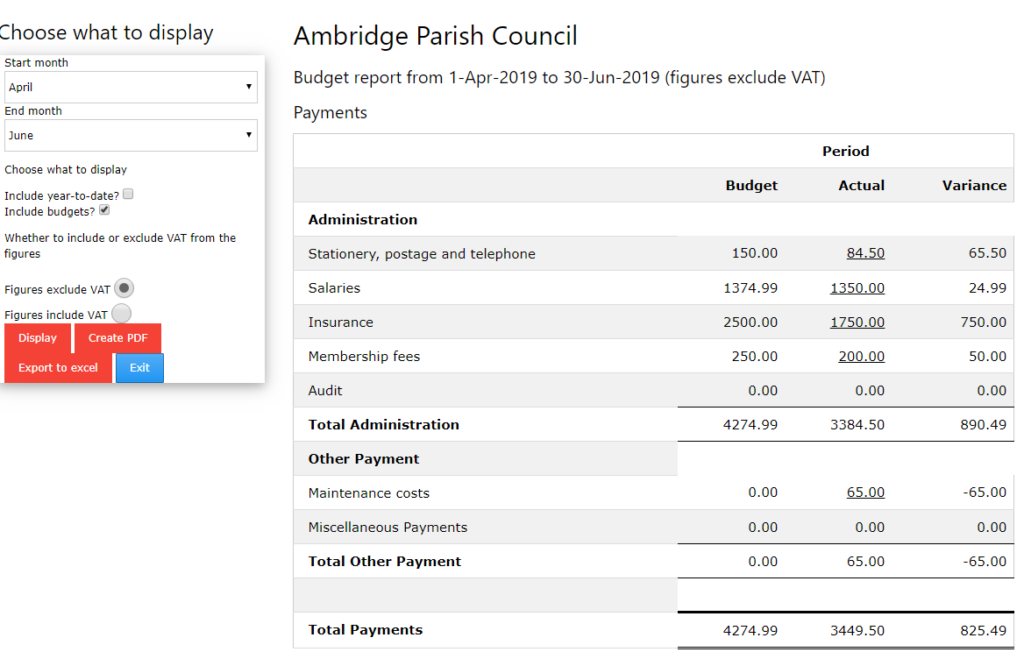
Here is an example report with the appropriate options selected:
Numbers in the report that are underlined are links. Clicking on one will display a list of transactions associated with that entry, in the same format as the Manage Transactions screen, allowing entries to be modified or deleted.

Menu Options
- Start month and end month: Sets the report’s date range. For example, setting the start month to April and the end month to June displays figures for the first quarter.
- Include year to date: Tick this box to include columns showing data from the start of the year to the selected period.
- Include budgets: Adds columns showing the budget for the period and the variance (difference between actual spend or receipts and the budget). Ticking the year-to-date box adds these columns for the entire year as well.
- VAT: Choose whether to include or exclude VAT in the displayed figures.
Here is an example report with the appropriate options selected

Numbers in the report that are underlined are links. Clicking on one will display a list of transactions associated with that entry, in the same format as the Manage Transactions screen, allowing entries to be modified or deleted.
Menu Buttons
- Display: Updates the screen view.
- Create PDF: Generates a PDF of the report.
- Export to Excel: Generates an Excel spreadsheet of the data, useful for adding comments to report lines for circulation.
Both of the reports should offer good transparency to the Council on the level of spend against specific Accounts Names and Groups.